PfDOZI localizes to cytoplasmic granules
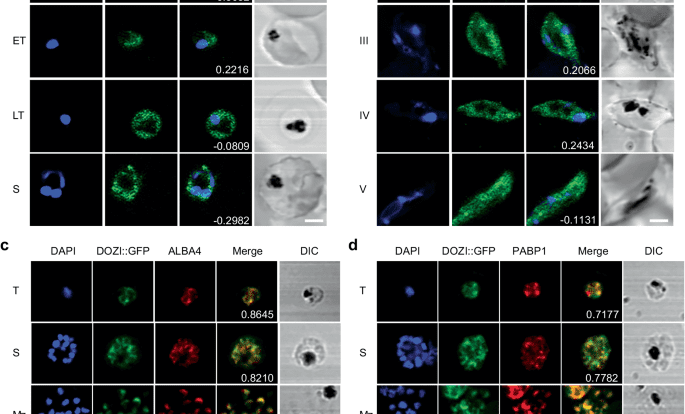
Using the PfDOZI::GFP parasite line with the endogenous PfDOZI C-terminally tagged with a green fluorescent protein (GFP), we showed that PfDOZI was highly expressed in schizont and gametocyte stages (Fig. S1a–c). Live fluorescence microscopy showed that PfDOZI::GFP was localized in cytoplasmic puncta of the parasite during the IDC, with increasing numbers of foci in the late stage (Fig. 1a). While similar fluorescent foci were observed in all gametocyte stages (Fig. 1b), the intensity of the GFP signals differed among individual gametocytes. Flow cytometry analysis confirmed this observation, dividing gametocytes at a ratio of ~1:1.5 into two populations of low- and high-GFP fluorescent intensities (Fig. S2a). Indirect immunofluorescence assays (IFA) using antibodies against α-tubulin II, the male gametocytes marker28, identified preferential expression of PfDOZI in female gametocytes (Fig. S2b), consistent with the finding from the analysis of sex-specific proteomes29,30. Co-localization studies using two markers of mRNP granules, Alba4, and PABP110,26,31,32, detected significant overlapping between PfDOZI::GFP and these two markers throughout development (Fig. 1c, d), suggesting the association of PfDOZI with mRNP granules marked by these RBPs.

a, b Representative live images of the PfDOZI::GFP parasites in asexual erythrocytic stages a and b stage II–V gametocytes. R, ring; ET, early trophozoite; LT, late trophozoite; S, schizont. Nuclei were counter-stained with DAPI. The numbers indicate the co-localization correlation coefficient between the GFP and DAPI fluorescence signals. Scale bar = 2 μm. c, d Co-localization of PfDOZI with Alba4 (c) and PABP1 (d) detected by IFA with the respective antibodies. T, trophozoite; S, schizont; Mz, merozoite; Gc, gametocyte. Nuclei were counter-stained with DAPI. The numbers indicate the co-localization correlation coefficient between the GFP and Alba4 or PABP1 fluorescence signals. DIC, differential interference contrast microscopy. Scale bar = 2 μm. All experiments in this figure were repeated three times independently with similar results.
Disruption of pfdozi enhances parasite proliferation and erythrocyte invasion
PfDOZI shares a similar domain structure as other DDX6 family members, consisting of an ATP-binding domain and a C-terminal helicase domain (Fig. S3a). To study the functions of PfDOZI, we disrupted the pfdozi gene (Δpfdozi) by deleting the majority of the helicase domain (130 aa), which was verified by Southern blot, Western blot and RNA-seq (Fig. S3). Comparing parasite growth in two Δpfdozi lines (K2 and K6) and the wild-type (WT) 3D7 parasites during the IDC, we did not find noticeable differences in the gross morphology and stage progression between the Δpfdozi and 3D7 parasites (Fig. S4a, b). However, the Δpfdozi lines showed increased proliferation and produced significantly higher parasitemias than the 3D7 control (Fig. 2a, p < 0.01). Microscopic examination of mature schizonts revealed that the Δpfdozi lines produced significantly more merozoites per schizont (16.2 ± 3.5 for K2 and 15.8 ± 3.8 for K6) than the WT 3D7 (14.1 ± 3.1) (Fig. 2b, p < 0.0001). In addition, the Δpfdozi merozoites showed significantly higher invasion rates than the 3D7 control in erythrocyte invasion experiments using either isolated merozoites (K2 vs. WT, p = 0.0115, K6 vs. WT, p = 0.0054) or mature schizonts (K2 vs. WT, p = 0.0155, K6 vs. WT, p = 0.0037) (Fig. 2c, d). These results indicated that pfdozi disruption increased parasites’ proliferation rate mainly due to enhanced production and invasion efficiency of merozoites.

a Growth curves of the parasite lines. Cultures of all parasite lines were started at 0.1% parasitemia. Parasitemia was determined by flow cytometry every 48 h for three successive IDCs. Complementation and overexpression were performed by episomally expressing PfDOZI-tdTomato in Δpfdozi K6 and the WT 3D7, respectively. Data are shown as mean ± SD from three replicates. Two-way ANOVA following Dunnett’s multiple comparisons test was employed for comparison, p-values are indicated above the plots. b Violin plot depicting the distribution of the number of merozoites per mature schizont in 3D7 (n = 280), two Δpfdozi clones (K2, n = 299 and K6, n = 304), and the complementation (Comp) parasites (n = 280). The top dashline indicates the upper quartiles, the middle dashline indicates the median, and the bottom dashline indicates the lower quartiles. c Invasion rates of merozoites estimated following the natural rupture of mature schizonts. The number of input schizonts was adjusted by the average number of merozoites per schizont of each group, n = 3 for each group. d Invasion rates of merozoites estimated using purified merozoites. Error bars in all panels indicate the mean ± SD from three replicates. One-way ANOVA followed by Dunnett’s multiple comparisons test was applied for p-values in all panels. Source data are provided as a Source Data file.
To confirm that phenotypic changes observed in the Δpfdozi lines were indeed due to pfdozi disruption, we performed complementation by episomally expressing PfDOZI in the Δpfdozi K6 clone (Fig. S5a). Expression of the tdTomato-tagged PfDOZI was verified by Western blot and live microscopy (Fig. S5b, c). Under these conditions, episomal expression of PfDOZI restored the growth and multiplication phenotypes of Δpfdozi to similar levels in the WT 3D7 (Fig. 2a, b). However, overexpression of PfDOZI-tdTomato in wild-type 3D7 was deleterious; transfected parasites were detected, but the parasitemia remained very low (Fig. 2a).
Disruption of pfdozi reduces sexual conversion and impairs gametocyte development
Investigation of gametocyte development showed that the Δpfdozi lines had significantly lower initial gametocytemia than 3D7, suggesting a reduction in the sexual conversion rate (Fig. 3a, p < 0.01). Gametocyte development in the Δpfdozi lines appeared normal during the early stages (days 1–6) but stopped progressing beyond stage-III (Fig. 3b). Subsequently, dead gametocytes (aberrant cells) increased in culture on days 6–8, concomitant with a sharp decrease in gametocytemia (Fig. 3a–c). Notably, both male and female gametocytes were affected by the loss of PfDOZI despite PfDOZI being more abundantly expressed in females. These defects in sexual conversion and gametocyte development in the Δpfdozi K6 were almost completely rescued by episomally expressing PfDOZI-tdTomato (Fig. 3a).

a Daily gametocytemia of two Δpfdozi clones (K2 and K6), 3D7 control, and complementation in clone K6 from day 3 through day 12 after induction. Gametocytemia was determined by counting Giemsa-stained gametocytes under a microscope. Data are shown as mean ± SD from three replicates. Two-way ANOVA following Dunnett’s multiple comparisons test was employed for comparison, p-values are indicated above the plots. b Representative images of Giemsa-stained gametocytes in 3D7 and Δpfdozi (K2) parasites at different days after induction. Scale bar = 2 μm. Similar results were obtained from three biological repeats. c Representative images of Giemsa-stained gametocytes illustrating the average percentage of live and dead gametocytes in the Δpfdozi line K2 on days 6–8. Scale bar = 2 μm. Similar results were obtained from three biological repeats. d Representative transmission electron microscope images showing the cytoskeleton structure of gametocytes in 3D7 and Δpfdozi parasites. The insets are the enlarged portions of the subpellicular structure showing the presence and absence of the microtubules in 3D7 and the Δpfdozi gametocytes, respectively. Scale bars = 200 nm. Similar results were obtained from two biological repeats. e Microtubule organizations in stage II (i), III (ii), and IV (iii) gametocytes of 3D7 (left panel) and Δpfdozi (right panel), Scale bars = 2 μm. Parasites were labeled with the anti-β-tubulin antibodies, and nuclei were counter-stained with DAPI. Similar results were obtained from two biological repeats. f Bar graph showing the mean β-tubulin immunofluorescence intensity in 3D7 and Δpfdozi gametocytes at different stages. Error bars indicate the mean ± SD. Two-tailed unpaired t-test, (i) p = 0.0013, degrees of freedom (df) = 50, (ii) p < 0.0001, df=60, (iii) p < 0.0001, df = 61. Source data are provided as a Source Data file.
The persistent, stage-III-like morphology of the developing gametocytes in Δpfdozi was reminiscent of the elongation defect observed in the knockdown of genes (e.g., PhIL1 and PIP1) encoding the inner membrane complexes (IMCs)33. This suggests that PfDOZI may have affected the cytoskeleton organization in the spindle- and banana-shaped stage VI and V gametocytes. To test this, ultrastructural analysis by transmission electron microscopy (TEM) showed a substantial reduction or disappearance of the microtubules and IMCs underneath the pellicles in Δpfdozi gametocytes (Fig. 3d, Fig. S6). Further, IFA with the anti-β-tubulin antibodies detected extensive disruption of the typical thread-like structure of the cytoskeleton (Fig. 3e) and a significant decrease in β-tubulin levels in Δpfdozi gametocytes (Fig. 3f, stage II, p = 0.0013, stage-III, p < 0.0001, stage IV, p < 0.0001). Thus, pfdozi disruption impaired sexual commitment and late-stage gametocyte development with defective cytoskeleton formation.
Pfdozi disruption leads to an increased abundance of invasion-related genes in schizonts
Because the DEAD-box helicases are involved in RNA metabolism, we wanted to determine whether pfdozi disruption impacted mRNA abundance in P. falciparum. RNA-seq analysis at four stages of the IDC identified 144 more and 137 less abundant transcripts in the Δpfdozi parasite compared to the WT (fold-change ≥ 2 and adjusted P (Padj) < 0.01, var gene transcripts excluded), which are grouped into four clusters by K-mean clustering (Fig. 4a, Fig. S7a, Supplementary Data 1: Table S1a–d). Clusters 1 and 4 include genes showing increased abundance at the ring and schizont stages, respectively, whereas Cluster 2 consists of all less abundant transcripts in the Δpfdozi parasite. For the 17 more and 73 less abundant transcripts at the ring stage in the Δpfdozi parasites (Fig. S7b), the Gene Ontology (GO) terms pellicle structure, host cell, and long-chain fatty acid ligase activity were enriched (Supplementary data 1: Table S1e). Pfdozi disruption minimally affected the trophozoites, with only 31 and 29 genes showing altered mRNA abundance at 20 and 30 h post-invasion (hpi), respectively (Fig. S7c, d). Among these 60 differentially expressed genes in trophozoites, an overwhelming majority (53) were less abundant in the Δpfdozi parasite (Fig. S7a). These genes with reduced mRNA abundance were enriched in multigene families encoding exported proteins. The most profound effect of pfdozi disruption on mRNA abundance was found at the schizont stage with 120 more and 11 less abundant transcripts. These genes with increased transcript levels normally had peak expression in schizonts (Fig. 4b), among which invasion-related genes and those associated with motor activity and cytoskeleton were highly enriched (Fig. 4b, c, Supplementary data 1: Table S1f), supporting the higher invasion efficiency of the Δpfdozi merozoites. The less abundant transcripts at 40 hpi include the master regulator of gametocytogenesis ap2-g and three gametocyte exported proteins (gexp04, pfg14-744, and pfg14-748), consistent with the reduced sexual conversion in Δpfdozi. The RNA-seq data for the gametocytogenesis-related genes were also verified by RT-qPCR analysis (Fig. S8). Notably, although the upstream gametocytogenesis regulator gdv1 showed an increased level in Δpfdozi schizonts, the ap2-g transcript level was much lower, suggesting increased decay of ap2-g transcripts in the absence of PfDOZI.

a The heat map depicting the K-mean clustering of differentially expressed genes in the Δpfdozi parasites at 10, 20, 30, and 40 h post-invasion (hpi) compared to the 3D7 parasites at the respective time points. b Volcano plot showing differential gene expression at the schizont stage (40 hpi) between Δpfdozi and WT 3D7 parasites. Each dot represents one gene and is displayed as log2 fold-change (x-axis) and the statistical significance of the association as -log10 (Padj) (y-axis). Transcripts with -log10 (Padj) above 16 were set as 16. Red dots indicate genes that are significantly increased in Δpfdozi, while blue dots are genes significantly decreased in Δpfdozi. Genes involved in RBC invasion and gametocytogenesis are labeled. c Bubble plot showing the gene ontology (GO) term analysis of the upregulated transcripts in the Δpfdozi parasite at 40 hpi. The three GO categories (cellular component, molecular function, and biological process) are shown in different colors. Only the GO terms with p < 0.05 are shown. The bubble size corresponds to the p-value of enrichment. Fold enrichment indicates the percentage of genes with a respective GO term in a group divided by the percentage of genes with this GO term in the whole genome. d Representative IFA images showing the PfAMA1 and PfMSP5 proteins in the 3D7 and Δpfdozi schizonts (left panel). Scale bar = 2 μm. Bar graphs in the right panel show the mean fluorescent intensity (FI) of PfAMA1 and PfMSP5 in the 3D7 and Δpfdozi schizonts at 40 hpi. n is the number of cells determined. Error bars indicate the mean ± SD (Two-tailed unpaired t-test, p-values are indicated above the plots). Similar results were obtained from two biological repeats. e Western blot analysis showing expression levels of PfAMA1 and PfMSP5 proteins in the 3D7 and Δpfdozi schizonts at 40 hpi (upper panel). PfAldolase was used as a loading control. The PfAMA1 and PfMSP5 protein bands were quantified by densitometry, normalized against PfAldolase, and the ratio between Δpfdozi and the WT 3D7 is shown in the bar graph (lower panel). Error bars indicate the mean ± SD from three replicates.
To determine if the rising levels of invasion-related genes corresponded to increased protein levels, we quantified the microneme protein AMA1 and merozoite surface protein 5 (MSP5) in schizonts. IFA analysis showed that AMA1 protein, measured by the mean fluorescent intensity, was more abundant in Δpfdozi than WT parasites (p < 0.0001), whereas MSP5 protein did not show a pronounced increase in the Δpfdozi parasites (Fig. 4d, p = 0.172). Western blot confirmed that both AMA1 and MSP5 had an about 2-fold increase in Δpfdozi than WT schizonts (Fig. 4e). Taken together, these results indicated that the predominant effects of pfdozi disruption were destabilization of mRNAs encoding exported proteins in ring and trophozoite stages, and increased stability of invasion-related mRNAs in the schizont stage. The transcriptomic analysis also suggests that PfDOZI’s primary function switches from transcript stabilization to degradation during the IDC.
Since the altered mRNA abundance could result from changes in transcription or mRNA metabolism, we next examined whether the dysregulation of mRNAs in Δpfdozi was due to altered RNA decay rates. We focused our analysis on the schizont stage, given the most profound effect of pfdozi disruption in this stage. Highly synchronized schizonts at 40 h of both WT and Δpfdozi K6 parasite lines were treated with actinomycin D to block transcription. Transcript abundance was determined by RNA-seq analysis using parasite RNA obtained at 0–300 min after treatment (Supplementary data 1: Table S1g). Whereas we did not see a noticeable change in genome-wide RNA decay between the Δpfdozi and WT parasites, the 120 genes with increased abundance in Δpfdozi showed a significant right shift in the RNA decay curve compared to the WT, indicating more extended half-lives for these mRNAs (Fig. S9).
Pfdozi disruption profoundly affects mRNA abundance in gametocytes
Transcriptomic analysis of stage-III gametocytes revealed a more profound effect of pfdozi disruption, with 833 and 727 genes with less and more abundant transcripts in Δpfdozi, respectively (Fig. 5a, Supplementary Data 2: Table S2), suggesting equally important roles of DOZI complexes in mRNA preservation and degradation in mid-stage gametocytes. About 80% of those transcripts with reduced levels are gametocyte/ookinete-specific or -enriched transcripts (Fig. 5b), including 5 AP2-domain transcription factors, several 6-cysteine proteins, 8 CPW-WPC family proteins, 6 LCCL domain proteins, 6 secreted ookinete proteins, RBPs (Puf1 and Puf2), and many transcripts related to cytoskeleton and microtubule (Supplementary Data 2: Table S2a). Like in pbdozi deletion in P. berghei26, pfs25 and pfs28 encoding the major ookinete surface proteins were among the top genes with decreased transcript abundance, showing a respective 214- and 18-fold reduction. Consistent with preferential PfDOZI expression in female gametocytes, transcripts with reduced abundance in Δpfdozi possessed a high mRNA abundance ratio of female/male gametocytes29, indicating that transcripts with reduced abundance were female-biased (Fig. 5c). GO analysis showed that genes related to microtubule/cytoskeleton, cellular respiration, and crystalloid were significantly enriched among these genes, which agrees with the defective morphogenesis of the Δpfdozi gametocytes (Fig. 5d, Supplementary Data 2: Table S2b). Among the 727 genes with increased transcript levels, 11 RBPs, genes involved in translation (translation and ribosome), and exportome (exported proteins, host cell cytosol) were significantly enriched (Supplementary Data 2: Table S2c). Unexpectedly, nearly 11% of these genes showing increased transcript abundance encode the parasite egress and invasion machinery, which likely represents the remaining transcripts after the RBC invasion since their transcription is turned off in gametocytes34. Notably, the more or less abundant transcripts in Δpfdozi gametocytes accounted for 4.5% and 8.3% of total reads in the WT gametocyte transcriptome.

a Volcano plot showing the mRNA level difference between Δpfdozi and WT gametocytes. Each gene is plotted for its log2 fold-change (x-axis) and -log10Padj (y-axis). Transcripts with –log10 (Padj) above 16 were set as 16. Red and blue dots indicate genes that are significantly increased and decreased in Δpfdozi, respectively. b Bar plot depicting the fractions of genes with stage-specific expression in stage II gametocytes (GCII), stage V gametocytes (GCV), and ookinetes (Ook)72, which are upregulated (red) or downregulated (blue) in Δpfdozi. *** indicates that significantly larger numbers of genes downregulated upon pfdozi deletion are stage II- or III-specific genes (two-tailed Fisher’s test, p < 1e-5). Stage-specific genes are defined as those with >2-fold-change compared with all other stages in the RNA-seq analysis. The proportions of upregulated and downregulated genes in the whole genome are shown as the background. c Boxplot showing sex-specific expression of the genes that are downregulated (blue), upregulated (red), or unchanged (black) upon pfdozi deletion. Sex specificity is represented as the ratio of the transcript between female and male gametocytes (FG/MG). The downregulated genes in the Δpfdozi line had a significantly higher FG/MG ratio when compared with the other two groups (two-tailed Wilcoxon signed-rank test, p < 2.2e-16). The FG/MG ratio was based on the P. falciparum male and female gametocyte transcriptomes29. The boxplot illustrates the range between the lower and upper quartiles (Q1 and Q3) of the dataset, with the median (Q2) marked by a line within the box. Whiskers extend from the box to demonstrate the data’s spread, adhering to the following criteria: the upper whisker reaches the last data point below Q3 plus 1.5 times the interquartile range (IQR), while the lower whisker extends to the first data point above Q1 minus 1.5 times the IQR. Data points beyond the whiskers are plotted individually. d Bubble plot showing the enrichment of different GO terms in upregulated and downregulated genes in the Δpfdozi gametocytes. Only GO terms with p < 0.05 are shown. The bubble size corresponds to the p-value of enrichment. Fold enrichment indicates the percentage of genes with this GO term in the specific group divided by the percentage of genes with this GO term in the whole genome. The enriched GO terms in downregulated and upregulated genes are shown to the left and right of the vertical dotted line, respectively. The GO categories are shown in different colors. Details of the GO analysis are shown in Supplementary data: Table S2b and S2c.
Given the more extensive overlaps of the less abundant genes in Δpfdozi with those in Δpbdozi and Δpbcith23,26, and the PbDOZI and PbCITH target genes27 (Fig. S10), DOZI’s mRNA-preserving role appeared evolutionarily conserved. The more significant role of PfDOZI in female gametocytes is further reflected in the extensive overlap between the less abundant genes in Δpfdozi and translationally repressed genes in P. falciparum female gametocytes29.
RIP-seq analysis identifies the extensive PfDOZI regulons
To identify the mRNA regulons of PfDOZI in schizonts and gametocytes, we performed RNA immunoprecipitation and sequencing (RIP-seq) analysis using the PfDOZI::GFP parasites. We identified 986 and 1366 transcripts as potential targets of the PfDOZI complexes in schizonts and gametocytes, respectively (Fig. 6a, b; Supplementary Data 3: Table S3a–c). The Malaria Parasite Metabolic Pathways (MPMP) analysis of the RIP-seq data showed enrichment of gene sets in merozoite invasion, protein exports and host surface binding, and apicoplast proteins in the schizont stage, and AP2-domain transcription factors and genes in crystalloid formation in the gametocyte stage (Supplementary Data 3: Table S3d). The putative PfDOZI mRNA regulons overlapped significantly with genes whose expression was disturbed upon pfdozi disruption (p < 0.001, Fisher’s exact test). In particular, the RIP-seq enriched transcripts shared 47/131 (35.9%) and 435/1560 (27.9%) transcripts with altered abundance in Δpfdozi schizonts and gametocytes, respectively (Fig. 6a, b, Supplementary Data 3: Table S3e–g). When considering the putative DOZI-bound transcripts only, 46 and 1 gene had increased and decreased transcript abundance in Δpfdozi schizonts, while 109 and 326 transcripts partitioned into more and less abundant transcripts in Δpfdozi gametocytes (Fig. 6a, b). For these shared transcripts in schizonts, genes involved in RBC invasion, host cell remodeling, and apicoplast targeting are enriched (Fig. 6a). In gametocytes, genes involved in the parasite exportome and RBC invasion were enriched among the shared genes with increased abundance in Δpfdozi, while genes destined for gametocyte development, motor and structure functions, crystalloid formation, and meiotic recombination were enriched among those shared with the less abundant genes in Δpfdozi (Supplementary Data 3: Table S3e–g). A cross-species comparison of the RIP results showed that PfDOZI had 146 and 166 common mRNA targets with PbDOZI and PbCITH in gametocytes27. Further, RT-qPCR analysis was performed to verify the mRNA targets of PfDOZI in schizonts and gametocytes, respectively (Fig. 6c). Consistently, p25 and p28 were enriched in the PfDOZI::GFP gametocytes as shown in PbDOZI23.

a, b Venn diagrams showing the overlap of transcripts between PfDOZI-associated mRNAs and differentially regulated genes in the Δpfdozi parasite at the schizont (a) and gametocyte (b) stage. The enriched pathways in each group were identified by the MPMP analysis. Blue, downregulated transcripts; Red, upregulated transcripts. c Real-time qRT-PCR confirmation of PfDOZI association with the selected transcripts. mRNAs immunoprecipitated using GFP-trap antibodies from the PfDOZI::GFP parasites at the schizont (blue) and gametocyte (red) stages were analyzed by qRT-PCR with primers specific to the indicated genes. Error bars indicate the mean ± SD of three independent experiments. All fold-change values are represented as the relative expression in comparison to the internal reference gene PF3D7_0717700. Source data are provided as a Source Data file.
PfDOZI is associated with different mRNPs in schizonts and gametocytes
Since the DDX6 RNA helicase is a component of various mRNPs in somatic cells (PBs and SGs) and germ cells (e.g., P granules) to carry out an array of functions in mRNA metabolism12,13,21,35, we hypothesized that PfDOZI might also be associated with different mRNPs to impose divergent actions on target mRNAs. To address this question, we performed immunoprecipitation (IP) using PfDOZI::GFP schizonts and purified gametocytes (day 5) with the GFP-trap beads under native conditions. We identified 112 PfDOZI-associated proteins in schizonts, including mRNA decay-related proteins typically found in PBs (the decapping enzymes DCP2 and DCP1, the decapping activators LSm1-4 and LSm7, and the deadenylase complex constituents NOT1, CAF1, and CAF40) and SGs [PABP1, G-strand binding protein 2–GBP236, eIF4A and eIF4E, Alba 1, 3, and 4, components of the 40 S ribosome (9 ribosomal proteins and RACK1 kinase), LSm12, CELF1, and CELF2], suggesting the formation of both PB-like and SG-like mRNPs in schizonts (Fig. 7A, Supplementary Data 4: Table S4a-h). It is noteworthy that the mRNA decay-related proteins (DCP2 and LSm2/4/7) were relatively more abundant in schizonts than the core SG components such as eIF4E and CITH (LSm14). MPMP analysis identified the enrichment of PB-related categories (constituents of PB, cytoplasmic PB assembly, LSm proteins and RNA processing, mRNA degradation), whereas the SG-related categories were not enriched, suggesting a more prominent role of the PfDOZI complex in mRNA decay (Fig. 7B, Supplementary Data 4: Table S4b).

A Venn diagram depicting the overlap of identified proteins with an average probability of ≥0.9 and FDR below 1.0% from the PfDOZI interactome analysis. PfDOZI was immunoprecipitated from the lysates of schizonts, gametocytes, and stressed schizonts (under nutrient starvation) under native conditions, and the precipitated proteins were identified by LC-MS/MS. B Bar graph showing the number of genes in individual pathways significantly enriched in the PfDOZI interactomes from gametocytes (blue), schizonts (red), and stressed schizonts (pink), respectively. The gray bars indicate the expected number of genes in each term, calculated as the total number of identified genes multiplied by the fraction of genes in the query function term in the whole genome. The asterisks indicate significant enrichment of the pathway in the PfDOZI interactome at the specified stage. C Heat map of selected proteins in the PfDOZI interactomes in gametocytes (GC), schizonts (S), and stressed schizonts (SS) based on the average probabilities. The proteins were grouped based on their putative functions. Only those known to be associated with P-body (PB) and stress granule (SG) in other organisms are included.
We identified 74 PfDOZI-associated proteins in gametocytes (Fig. 7, Supplementary data 4: Table S4c); 34 were shared with those identified in schizonts, including proteins typically found in PBs (CAF40 and NOT1) and SGs (PABP1, eIF4E, eIF4A, and Alba1/3/4) (Fig. 7A, Supplementary Data 4: Table S4h). Of the components previously identified in the DOZI, CITH, and Alba4 complexes in the rodent parasites P. berghei and P. yoelii10,26, 13 were identified in the PfDOZI complexes, including PfDOZI, eIF4E, PABP1, CITH, Alba1/3/4, CELF2/HoBo and enolase (Fig. 7C), whereas HoMu, Alba2, and phosphoglycerate mutase were not detected or did not pass the selection criteria. Compared to schizonts, the most distinct feature of the PfDOZI interactome in gametocytes is the enrichment of the SG- or GCG-related categories (P granule, stress granule assembly, and cytoplasmic stress granule), glycolysis (enolase and 6-phosphofructokinase), and CCR4-NOT complex (CAF40 and NOT1-G). Besides, the PfDOZI gametocyte interactome included seven additional RBPs. Except for lacking germ plasm proteins specific for metazoans, the gametocyte DOZI complex resembled the GCGs in Drosophila ovaries37, which is also consistent with the formation of P granule (C. elegans GCGs)-like mRNPs in gametocytes of the rodent parasites10,26.
The above interactome studies suggested dynamic changes in protein and mRNA compositions of PfDOZI mRNPs during P. falciparum development. Since malaria parasites are exposed to various stress conditions in their life history, we wanted to determine whether stress would alter the organization of mRNPs. After exposing PfDOZI::GFP to nutrient stress, we performed targeted proteomics of the schizont stage and identified 123 proteins (Supplementary Data 4: Table S4e). Compared with the normal culture conditions, nutrient starvation drastically changed the PfDOZI interactome, with only 23 proteins preserved between the two culture conditions (Fig. 7A, Supplementary Data 4: Table S4g). Particularly, several GO categories significantly enriched in normal schizonts (proteasome, chaperone and protein folding, ribosome, nucleocytoplasmic transport, and microtubule cytoskeleton organization) were not enriched in the stressed schizonts (Fig. 7B). Although the PB-related categories remained enriched, stressed schizonts had significant enrichment of mRNA degradation (CCR4-NOT complex, decapping) and the SG-related terms (stress granule assembly and P granule). The GO terms translation initiation, negative regulation of translation, and eIF2B complex were also enriched (Fig. 7B, Supplementary Data 4: Table S4f). In addition, the PfDOZI interactome in stressed schizonts also contained a plethora of ATP-dependent helicases and protein remodelers (chaperones and the chaperonin-containing T complex–CCT complex) (Fig. 7C). These ATP-dependent cellular machines are conserved constituents of the yeast and mammalian SGs, playing divergent roles in SG assembly38. Further, the 40S ribosomes were depleted under nutrient stress (Fig. 7C), reminiscent of the SGs formed under chronic nutrient starvation in mammalian cells39. These changes in PfDOZI-associated proteins in response to nutrient stress suggest the formation of SG-like granules.
The PfDOZI interactomes between stressed schizonts and gametocytes only shared 12 proteins, indicating major differences in the mRNP granules (Fig. 7A, B, Supplementary Data 4: Table S4g). The gametocyte DOZI interatomes included PABP1, CITH, eIF4A, eIF4E, GBP2, Alba1/3/4, and 40 S ribosomal proteins, resembling the GCGs in metazoans. In contrast, the SG components in the stressed schizonts contained PfDOZI, PABP2, CITH, PAIP1 (PABP-interacting protein 1), eIF2B complex, and eIF3M, but were deficient in eIF4A, the Alba proteins, GBP2, and the 40S ribosomal proteins (Supplementary Data 4, Table S4h). These differences suggest that gametocytes and schizonts may employ different mechanisms involving divergent PfDOZI complexes to regulate their target mRNAs.
Since the DOZI homolog is present in PBs, SGs, and GCGs in model eukaryotes, we wanted to determine whether it also partitions into different mRNPs in P. falciparum. To identify mRNP sub-complexes, we selected DCP2 and GBP2 as potential PB and SG markers, respectively. In model organisms, DCP2 is a constitutive PB component40, while GBP2 accumulates in SGs under stress conditions41. We tagged the endogenous loci of DCP2 and GBP2 with GFP at their C termini, and correct tagging was confirmed by integration-specific PCR and Western blots (Fig. S11). Protein pulldown and proteomic analysis of PfDCP2::GFP parasites at the schizont stage identified 34 proteins in the PfDCP2 interactome (Supplementary Data 4, Table S4i), including PfDOZI and constituents of the CCR4-NOT complex (NOT1, NOT1-G, and CAF40). The PfDCP2 interactome is enriched in GO terms related to the mRNA catabolic process. In comparison, the PfGBP2-GFP interactome from stressed schizonts included PfDOZI, PfCITH, eIF4A, PABP1, Alba proteins, translation initiation factors, and components of the 40 S ribosome, but they were devoid of proteins of the RNA decay pathway (Supplementary Data 4, Table S4k), suggesting the partition of PfGBP2 into SG-like mRNPs. Moreover, PfDCP2 and PfGBP2 did not precipitate each other, and their interactomes had a minimal overlap, only sharing the core element DOZI (Fig. S12).
These PfDOZI interactome studies indicate that PB-like and GCG-like RNP granules were more predominant in schizonts and gametocytes, respectively. Reciprocal pulldown analyses confirmed PfDOZI as a shared component in different mRNPs and supported the existence of PB- and SG-like sub-complexes in the PfDOZI interactomes. Stress conditions could lead to substantial remodeling of the PfDOZI complexes, suggesting the formation of SG-like mRNPs.
Pfdozi disruption compromises the parasite’s stress responses
With the evidence of PfDOZI’s participation in SG-like mRNPs in P. falciparum, we wanted to determine if pfdozi disruption affects the parasite’s stress response. We investigated the response of the schizonts to nutrient starvation as the stress condition. Although the WT and Δpfdozi schizonts had similar numbers of transcripts (781 and 848, respectively) with significantly altered levels under nutrient starvation, the proportions of genes with increased or decreased levels were markedly different (Fig. 8A, B). The stressed WT parasites showed almost four-fold more genes with increased abundance (621) than those with less abundant transcripts (160), indicating that more transcripts were protected from degradation during nutrient stress (stressed WT vs. control WT, Supplementary data 5: Table S5a). Under nutrient stress, Δpfdozi schizonts had an opposite trend in mRNA abundance: 368 and 480 genes with more and less abundant transcripts, respectively (stressed Δpfdozi vs. control Δpfdozi), suggesting compromised protection of transcripts in Δpfdozi. These results showed that the WT and Δpfdozi parasites differed drastically in steady-state mRNA levels in response to nutrient stress (P < 0.00001, χ2 test). Furthermore, a direct comparison of the transcriptomic changes between the WT and Δpfdozi under the stress conditions revealed that pfdozi disruption led to 598 genes with altered transcript levels, 92.6% of which showed reduced transcript levels (Fig. 8C, Supplementary Data 5: Table S5a), further highlighting the Δpfdozi’s defects in stabilizing transcripts.

A–C Volcano plots showing differential gene expression in schizonts at 40 hpi grown under nutrient stress vs. normal conditions in the WT 3D7 (A) and Δpfdozi parasites (B). A comparison in gene expression under nutrient stress conditions between Δpfdozi and WT 3D7 parasites is shown in C. For all the volcano plots, each dot represents one gene and is displayed as log2 (fold-change) on the x-axis and -log10(Padj) in the y-axis. All -log10 (Padj) above 16 were set as 16. Statistically upregulated and downregulated genes for each comparison are shown as red and blue dots, respectively. D Heat map depicting the K-mean clustering of differentially expressed transcripts in WT and Δpfdozi parasites grown under normal or stress conditions. The number of transcripts in each cluster was indicated in the parenthesis. Str., stressed. E Bar graphs showing the enriched pathways in Cluster 1, 2, 5, and 7 from MPMP analysis. The y-axis indicates the number of genes identified (blue) compared to the number expected (orange) for each enriched pathway.
To further illustrate the effect of nutrient stress on mRNA metabolism, mRNAs with altered levels were classified into seven clusters (Fig. 8D, Supplementary Data 5: Table S5b). Cluster 1 (n = 343) mRNAs were more abundant in stressed WT but no apparent change in the stressed Δpfdozi, while Cluster 2 (n = 215) mRNAs were more abundant in stressed WT but less in stressed Δpfdozi. MPMP analysis indicated that RBC invasion and protein export were significantly enriched in these two clusters (Fig. 8E, Supplementary Data 5: Table S5c). In addition, as retention of spent culture medium is routinely used to induce gametocytes, the increased levels of genes involved in sexual commitment (ap2-g) and earlier gametocyte development (pfg14-744 and pfg14-748) in the WT parasites is consistent with the induction of gametocytogenesis (Fig. 8A, E). However, ap2-g and several early gametocyte genes were among the top genes with reduced transcript levels in stressed Δpfdozi, consistent with the lower sexual conversion rate observed in Δpfdozi. Cluster 5 includes 121 downregulated transcripts in stressed WT but with no significant change in stressed Δpfdozi, which are enriched in Rab proteins, proteasome machinery, ATPase activity, and translation-related (translationally repressed transcripts, ribosome, and translation), suggesting that these cellular activities (transport, protein degradation, and translation) were halted during stress. Collectively, these results indicated that the stress conditions applied caused the schizonts to shift to preserve transcripts involved in RBC invasion and gametocytogenesis, whereas this response was compromised in the Δpfdozi parasites.
Source link