AZGP1 is associated with obesity in humans and mice
To explore the relationship between AZGP1 and obesity in humans, circulating AZGP1 levels were measured in overweight (BMI 24–27.9 kg/m2), obese (BMI ≥ 28 kg/m2) and normal-weight (BMI 18.5–23.9 kg/m2) individuals. We found that the circulating AZGP1 levels in overweight/obese individuals were considerably lower than those in controls (Supplementary Fig. 1a). Correlation analysis revealed that AZGP1 was adversely correlated with BMI (Supplementary Fig. 1b). These findings indicate that AZGP1 may be physiologically involved in maintaining normal BW. Next, we examined the expression of AZGP1 protein in the hypothalamus of C57BL/6J (WT) mice of different ages and found that AZGP1 expression was lower at postnatal days 1 (P1) to 20 (P20) and in elderly mice (18 and 24 months), while higher expression was observed in mice aged 1–12 months. Therefore, these results suggest that AZGP1 expression in the hypothalamus is age dependent (Fig. 1a). The current study was performed in mice aged 8–12 weeks, a period coinciding with abundant AZGP1 expression in the hypothalamus.

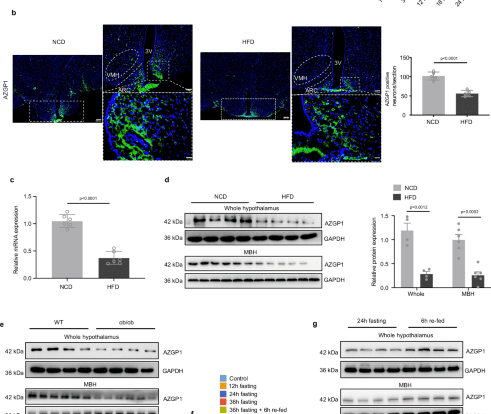
a Immunoblotting analysis for AZGP1 protein expression in the hypothalamus of male mice pups (P1-20) and mice (1–24 months) (n = 5 mice). b–d Eight-week-old male WT mice were fed a NCD or HFD for 12 weeks. b Representative IF image of AZGP1 staining in the hypothalamus (n = 5 mice); scale bars: 200 μm (left), 100 μm (upper right), 20 μm (lower right). c Azgp1 mRNA levels in the hypothalamus (n = 6 mice). d AZGP1 protein levels in the whole hypothalamus and mediobasal hypothalamus (MBH) (whole hypothalamus n = 4 mice; MBH n = 6 mice). e AZGP1 protein levels in the whole hypothalamus and MBH of WT and ob/ob mice (whole hypothalamus n = 4 mice; MBH n = 6 mice). Azgp1 mRNA (f) and protein (g) expression in the whole hypothalamus and MBH of WT mice under fasting and refeeding conditions (n = 6 mice for mRNA; n = 4 mice for protein). 3V third cerebral ventricle, ARC arcuate nucleus, VMH ventromedial nucleus. The data are shown as the mean ± SEM. Two-tailed Student’s t tests were used in (b–e) and (g), and one-way ANOVA followed by Tukey’s test was used in (a) and (f). Source data are provided as a Source Data file.
To investigate the role of AZGP1 in energy homeostasis, AZGP1 mRNA and protein expression in lean compared with DIO or genetically obese mice was analyzed. Immunofluorescence (IF) staining showed that AZGP1 was most strongly expressed in metabolism-related hypothalamic nuclei, the ARC and the ventromedial hypothalamus (VMH). In addition, the number of AZGP1-positive neurons was significantly reduced in high-fat diet (HFD)-fed mice (Fig. 1b). This result was further supported by reduced AZGP1 mRNA and protein expression levels in the hypothalamus and isolated mediobasal hypothalamus (MBH), including the ARC and VMH, of HFD-fed mice and ob/ob mice (Fig. 1c–e).
Next, C57BL/6J (WT) mice were subjected to a fasting-refeeding protocol. The mRNA expression of Azgp1 was significantly decreased in the hypothalamus as the fasting period increased (from 12 h to 36 h) (Fig. 1f). AZGP1 expression was rapidly restored in the hypothalamus and isolated MBH samples of fasted mice after refeeding (Fig. 1f, g), suggesting that the AZGP1 level in the hypothalamus was closely related to nutrition status (feeding). Taken together, these results indicated that AZGP1 is differentially expressed in the hypothalamic MBH and is important for energy balance. Changes in energy status result in alterations in AZGP1 expression in the hypothalamus.
Overexpression of AZGP1 in the hypothalamus ameliorates DIO
To determine whether AZGP1 is involved in the central control of energy homeostasis in vivo, adeno-associated viruses encoding Azgp1 or GFP (AAV9-Azgp1/GFP) were injected into the MBH of 8-week-old male WT mice (Fig. 2a). The location of the injection site and efficacy of virus transduction were confirmed by IF staining (Fig. 2b). As expected, AZGP1 protein was highly expressed in the hypothalamus after injection (Fig. 2c).

a Schematic representation of the experimental procedure. b Representative IF images showing GFP expression in the hypothalamus (n = 5 mice; scale bars: 200 μm). c AZGP1 protein expression in the hypothalamus (n = 8 mice). d A representative photograph of NCD- and HFD-fed mice (n = 5 mice). e Body weight curves of NCD- and HFD-fed mice (n = 7 mice). f Representative images of eWAT depots in HFD-fed mice (n = 5 mice). g Body composition in HFD-fed mice (n = 7 mice). h Energy intake (n = 7 mice). i Rectal temperature (n = 8 mice). j Energy expenditure (n = 7 mice). k Energy expenditure in HFD-fed mice (n = 7 mice). l Representative H&E staining image of BAT (n = 5 mice; scale bars: 50 μm). m UCP1 staining of BAT in NCD or HFD-fed mice (n = 5 mice); scale bars: 100 μm. n Ucp1 mRNA expression in BAT (n = 8 mice). o Representative H&E staining image of eWAT (n = 5 mice; scale bars: 50 μm). p Cross- sectional areas of eWAT (n = 5 mice). q DNA content of eWAT in HFD-fed mice (n = 5 mice). r Western blot analysis of p-PKA and p-HSL/HSL levels in the eWAT of HFD-fed mice and densitometric analysis (n = 4 mice). 3V third cerebral ventricle, MBH mediobasal hypothalamus. The data are expressed as the mean ± SEM. Two-tailed unpaired Student’s t test (c), (g), (n), (q, r) and one-way ANOVA followed by Tukey’s test (i), or two-way ANOVA followed by Bonferroni’s post hoc tests (e), (h), (j), one-way ANCOVA using body weight as covariate (k). Source data are provided as a Source Data file. (n.s. not significant.).
To further evaluate the effects of hypothalamic AZGP1 on metabolic phenotypes, mice were fed a normal chow diet (NCD) or a HFD for 12 weeks (Fig. 2a). Upon HFD feeding, Azgp1-overexpressing mice had a reduced BW and decreased adiposity (Fig. 2d–g). This phenotype was associated with decreased energy intake and increased body temperature and energy expenditure (Fig. 2h–k). However, the BW, energy intake, rectal temperature and energy expenditure of the hypothalamic Azgp1-overexpressing mice fed an NCD diet were comparable to those of the control mice (Fig. 2d, e and h–j). Furthermore, in agreement with the increase in energy expenditure observed in HFD-fed Azgp1-overexpressing mice, there was a notable decrease in the number of lipid droplets and increase in UCP1 expression in brown adipose tissue (BAT) (Fig. 2l–n). Accordingly, H&E staining of epididymal white adipose tissue (eWAT) showed that Azgp1 overexpression in the hypothalamus significantly reduced the adipocyte volume but not cell number, as determined by DNA content analysis (Fig. 2o–q). The decrease in adipocyte volume observed in HFD-fed mice with hypothalamic AZGP1 overexpression suggested enhanced lipolysis. Consistently, the levels of phosphorylated protein kinase A (PKA) and hormone-sensitive lipase (HSL), two key regulatory enzymes for lipolysis, were also significantly increased in the eWAT of these mice (Fig. 2r). Consistent with the observed resistance to obesity, a fasting-refeeding experiment showed that HFD-fed mice injected with AAV-Azgp1 into the MBH had lower fasting and postprandial blood glucose levels (Supplementary Fig. 2a). The glucose tolerance test (GTT) and insulin tolerance test (ITT) revealed that under HFD feeding, glucose tolerance and insulin sensitivity were improved in mice overexpressing AZGP1 compared with control mice (Supplementary Fig. 2b, c). Consistent with the overall improvement in glucose homeostasis, hepatic lipid deposition in HFD-fed mice with hypothalamic AZGP1 overexpression was largely reduced (Supplementary Fig. 2d, e). However, AZGP1 overexpression in the hypothalamus did not lead to alterations in blood glucose levels, insulin sensitivity, glucose tolerance or histological changes in the liver under NCD feeding (Supplementary Fig. 2b–e). These results suggest that overexpression of AZGP1 in the hypothalamus improves glucose and lipid metabolism and prevents the development of obesity induced by HFD feeding.
AZGP1 signaling in POMC neurons regulates energy metabolism
POMC and AgRP/NPY neurons play important roles in the regulation of food intake and energy homeostasis in the hypothalamic ARC26. To investigate the neuronal population in which AZGP1 functions, we assessed the distribution of AZGP1 in hypothalamic ARC neurons. We found that AZGP1 was widely expressed in these neurons, including those expressing POMC and AgRP (Fig. 3a). In the ARC, AZGP1 was expressed in 94.2% of POMC-expressing neurons and 86% of AgRP-expressing neurons (Fig. 3a). However, AZGP1 expression was rare in glial cells, as indicated by the labeling of AZGP1 with glial fibrillary acidic protein (GFAP) (Fig. 3a). Furthermore, the expression of AZGP1 in POMC neurons was lower in young and elderly mice but higher in adult mice (Supplementary Fig. 3).

a Hypothalamic slices from NCD-fed male WT and POMC/Agrp-Cre:tdTomato mice were subjected to immunostaining with anti-AZGP1, anti-GFAP, and anti-neuronal protein (NeuN) antibodies. IF staining for AZGP1 expression (left) and the percentage of AZGP1-expressing neurons (right) (n = 3 mice; scale bar: 50 μm). b–d Eight-week-old male WT mice were given an injection of AAV9-Azgp1/GFP with or without leptin into the MBH. b The mRNA expression of Agrp and Pomc in the hypothalamus (n = 6 mice). c IHC staining of POMC and AgRP in the mouse ARC (n = 3 mice; scale bar: 100 μm). d IF staining of POMC and c-Fos in the mouse ARC (n = 3 mice; scale bar: 50 μm). 3V third cerebral ventricle, ARC arcuate nucleus. The data are expressed as the mean ± SEM, two-tailed Student’s unpaired t-test for (b–c), and one-way ANOVA, followed by Tukey’s multiple comparison test for (d). Source data are provided as a Source Data file. (n.s., not significant.).
To further evaluate the effects of AZGP1 on distinct neuronal populations, 8-week-old male WT mice were injected with AAV9-Azgp1/GFP into the MBH. Compared with that in MBH AVV9-GFP mice, AZGP1 overexpression resulted in a significant increase in Pomc mRNA expression in MBH AVV9-Azgp1 mice, whereas there was no significant difference in Npy or Agrp mRNA expression (Fig. 3b). Immunohistochemical (IHC) staining showed that POMC expression in the ARC was significantly greater in MBH AAV9-Azgp1 mice than in control mice, while AgRP expression remained unchanged (Fig. 3c). Next, mice were injected with leptin into the MBH to determine the effect of AZGP1 on the leptin-induced excitability of POMC neurons, as assessed by c-Fos staining. The results showed an increase in c-Fos staining intensity in POMC-expressing cells in MBH-AAV9-Azgp1 mice compared to control mice (Fig. 3d). These findings imply that Azgp1 overexpression in the hypothalamic ARC may increase POMC expression and neuronal activity.
To delineate the role of AZGP1 in POMC neurons, a Cre-dependent AAV9 expressing Azgp1 or GFP (AAV9-DIO-Azgp1/GFP) was injected into the MBH of POMC-Cre mice to specifically overexpress AZGP1 in POMC neurons (POMC-Azgp1-OE mice), and the mice were fed an NCD or HFD for 12 weeks (Fig. 4a). GFP immunostaining was performed to confirm the injection site and efficacy of virus transduction in the ARC (Supplementary Fig. 4a). Overexpression of AZGP1 in POMC neurons reduced BW, fat mass, and energy intake, while increasing energy expenditure and body temperature in HFD-fed mice (Fig. 4b–i). Histological examination showed that AZGP1 overexpression in POMC neurons resulted in more BAT depots, fewer lipid droplets and increased Ucp1 mRNA and protein expression in BAT under HFD feeding (Fig. 4j–m).

a Schematic diagram of the experimental procedure. b Representative photograph of the mice (n = 8 mice). c Body weight curve (n = 8 mice). d Representative image of eWAT depots (n = 3 mice). e Body composition (n = 8 mice). f Energy intake (n = 7 mice). g Energy expenditure (n = 7 mice). h Energy expenditure (n = 7 mice). i Rectal temperature (n = 8 mice). j Representative image of BAT depots (n = 5 mice). k Representative H&E staining image of BAT (n = 5 mice; scale bar: 100 μm). l UCP1 immunostaining in BAT (n = 5 mice; scale bar: 100 μm). m Ucp1 mRNA expression in BAT (n = 7 mice). n Th and Adrß3 mRNA expression in BAT (n = 10 mice). o Representative H&E staining image of eWAT (n = 5 mice; scale bar: 50 μm). p Cross-sectional area of eWAT quantified by ImageJ analysis (n = 5 mice). q DNA content in total eWAT (n = 7 mice). r Western blot analysis of p-PKA and p-HSL/HSL expression in the eWAT of HFD-fed mice and densitometric quantification (n = 4 mice). MBH, mediobasal hypothalamus. The data are expressed as the mean ± SEM. Statistical significance was calculated using an unpaired two-tailed t-test (e, m, n, q, r) and one-way ANOVA followed by Tukey’s test (i), or two-way ANOVA followed by Bonferroni’s post hoc tests (c, f, g), one-way ANCOVA using body weight as covariate (h). Source data are provided as a Source Data file. (n.s. not significant.).
Previous studies have shown that activation of the SNS increases BAT thermogenesis27,28,29. Here, we found that the expression of tyrosine hydroxylase (Th), an enzyme involved in the synthesis of catecholamines, and a norepinephrine receptor (Adrβ3) was markedly higher in BAT from HFD-fed POMC-Azgp1-OE mice than in BAT from control mice fed the same diet, suggesting that activation of AZGP1 in POMC neurons increases SNS signaling (Fig. 4n). The volume of WAT was decreased, while there was no significant change in the number of adipocytes in adipose tissue (Fig. 4o–q). In addition, the phosphorylation of PKA and HSL in eWAT was significantly increased in HFD-fed POMC-Azgp1-OE mice compared with POMC-Cre mice fed the same diet (Fig. 4r), but there was no difference in the expression of fatty acid uptake- or lipogenesis-related genes in eWAT (Supplementary Fig. 4b). Furthermore, histological examination of the liver revealed a significant reduction in lipid deposition in POMC-Azgp1-OE mice compared with control mice fed a HFD (Supplementary Fig. 4c, d). These results indicate that Azgp1 overexpression in POMC neurons promotes BAT thermogenesis and TG lipolysis in eWAT.
To assess the effect of AZGP1 signaling in the hypothalamus on glucose metabolism, a fasting-refeeding experimental protocol was performed. The results showed that fasting blood glucose levels (FBG, 0 h, and 12 h) and blood glucose levels 1–2 h after refeeding were significantly lower in HFD-fed POMC-Azgp1-OE mice than in control mice fed the same diet (Supplementary Fig. 4e), suggesting that glucose utilization was promoted by AZGP1 overexpression. Furthermore, HFD-fed POMC-Azgp1-OE mice had improved glucose tolerance and insulin sensitivity compared to their POMC-Cre littermates (Supplementary Fig. 4f, g), suggesting that POMC-AZGP1 signaling ameliorates glucose metabolism and insulin sensitivity. Notably, we found that when POMC-Azgp1-OE mice were fed a HFD for 4 weeks, a duration insufficient to alter their BW, the overexpression of AZGP1 did not improve TG levels, glucose tolerance, or insulin sensitivity (Supplementary Fig. 4h–l). This finding suggested that the effect of AZGP1 on glucose/lipid metabolism in HFD-fed mice may be due to differences in BW. Furthermore, a similar metabolic phenotype was also observed in female mice (Supplementary Fig. 5a–n).
Next, we used a gain-of-function approach to investigate the role of AZGP1 in energy metabolism in AgRP neurons. To do this, AgRP-Cre mice were given bilateral injections of AAV9-DIO-Azgp1/GFP into the MBH to induce AZGP1 overexpression specifically in AgRP neurons (AgRP-Azgp1-OE) and fed either an NCD or HFD for 12 weeks (Supplementary Fig. 6a). The efficiency of virus transduction in the MBH was confirmed by GFP immunostaining (Supplementary Fig. 6b). Surprisingly, there were no differences in BW, energy intake, or energy expenditure between Agrp-Azgp1-OE mice fed a HFD or NCD and AgRP-Cre mice (Supplementary Fig. 6c–h). In addition, adiposity, liver steatosis, glucose tolerance, and insulin sensitivity were not altered by the overexpression of Azgp1 in AgRP neurons (Supplementary Fig. 6i–o). Taken together, these results imply that Azgp1 signaling in POMC neurons, but not in AgRP neurons, regulates whole-body energy metabolism.
Inducible ablation of Azgp1 in POMC neurons exacerbates DIO
Since the overexpression of AZGP1 in POMC neurons prevented the development of DIO, ablation of Azgp1 in POMC neurons might exacerbate DIO. To avoid the developmental effects of Azgp1 deletion, tamoxifen-induced POMC-CreER mice expressing tdTomato (POMC-CreER-tdTomato) were crossed with Azgp1fl/fl mice to generate mice with selective deletion of Azgp1 in POMC neurons (POMC-Azgp1 KO mice). In this model, Cre recombinase activity was controlled temporally to allow the deletion of Azgp1 in adulthood30 (Fig. 5a). IF staining for tdTomato (representing POMC neurons) and AZGP1 showed that AZGP1 was localized to POMC neurons in POMC-CreER-tdTomato mice but was almost completely absent in POMC-Azgp1 KO mice (Supplementary Fig. 7a). As shown in Fig. 5b–d, BW and energy intake were significantly increased in POMC-Azgp1 KO mice compared with those in Azgp1fl/fl mice (tamoxifen administered at 6 weeks of age) under HFD feeding, while energy expenditure and body temperature were dramatically reduced (Fig. 5e–g). Accordingly, these changes were accompanied by an increase in adipocyte hypertrophy and a decrease in PKA and HSL phosphorylation in eWAT (Fig. 5h–k). Furthermore, H&E staining revealed a significant increase in the size of adipocytes, along with a decrease in Ucp1 mRNA and protein expression in the BAT of HFD-fed POMC-Azgp1 KO mice (Fig. 5l–n). Similar to the alterations in adipose tissue, more lipid droplets were observed in the livers of POMC-Azgp1 KO mice than in those of Azgp1fl/fl controls after 12 weeks of HFD feeding (Supplementary Fig. 7b, c). Moreover, the exacerbation of DIO in POMC-Azgp1 KO mice was accompanied by compromised glucose tolerance and clearance (Supplementary Fig. 7d, e). Altogether, these results further demonstrated that AZGP1 signaling in POMC neurons regulate energy balance and glucose/lipid metabolism.

a Schematic diagram of the experimental procedure. b Representative image of 20-week-old mice (n = 3 mice). c Body weight curve (n = 10 mice). d Energy intake (n = 8 mice). e Energy expenditure (n = 8 mice). f Energy expenditure (n = 8 mice). g Rectal temperature (n = 9 mice). h H&E staining of eWAT (n = 5 mice); scale bars: 100 μm. i Cross-sectional area of eWAT quantified by ImageJ analysis (n = 5 mice). j, k Western blot analysis of p-PKA and t-HSL/p-HSL expression in eWAT of HFD-fed mice and densitometric quantification (n = 4 mice). l H&E staining of BAT (n = 5 mice; scale bars: 200 μm). m UCP1 immunostaining of BAT (n = 5 mice; scale bars: 100 μm). n Ucp1 mRNA expression in BAT (n = 6 mice). The data are expressed as the mean ± SEM. Statistical significance was calculated using a two-way ANOVA followed by Bonferroni’s post hoc tests for (c–e); one-way ANCOVA using body weight as covariate (f); one-way ANOVA, followed by Tukey’s test for (g); two-tailed Student’s unpaired t-test for (k, n). Source data are provided as a Source Data file.
The metabolic function of central AZGP1 is related to leptin signaling
Since leptin acts as the main contributor to appetite control by increasing POMC expression and inhibiting AgRP/NPY expression in the ARC31, alterations in AZGP1 expression in the hypothalamus may affect leptin receptor (ObRb) signaling. To confirm this, ObRb-Cre mice were given bilateral injections of AAV9-DIO-Azgp1/GFP into the MBH and fed a NCD or HFD for 12 weeks (Supplementary Fig. 8a). Postmortem IF staining for GFP confirmed that the ARC and VMH were effectively targeted by the virus (Supplementary Fig. 8b). Remarkably, in the DIO model, Azpg1 overexpression within hypothalamic ObRb neurons led to notable alleviation of obesity-like phenotypes and metabolic dysfunction (Supplementary Fig. 8c–p and 9a, b), including increased insulin sensitivity (Supplementary Fig. 9c, d). Conversely, Azgp1 overexpression in hypothalamic ObRb neurons did not alter the metabolic phenotype in lean mice (Supplementary Fig. 8c, d, f, g, i, j, l–o). Moreover, IF staining showed that AZGP1 overexpression in ObRb neurons increased MBH leptin-stimulated POMC expression and neuronal excitability in the ARC of HFD-fed mice, as indicated by an increase in the number of c-Fos-positive cells (Supplementary Fig. 9e, f). These results indicate that central AZGP1 is associated with leptin signaling and that AZGP1 overexpression in ObRb neurons elevates energy consumption by increasing the excitability of POMC neurons.
AZGP1 regulates energy homeostasis via the leptin-JAK2/STAT3/POMC pathway
Leptin signaling increases POMC expression and suppresses AgRP expression via the Janus-activated kinase (JAK)-2 and signal transducer and activator of transcription (STAT3) pathways to regulate energy metabolism31. Thus, AZGP1 in POMC neurons may affect the leptin signaling cascade. To investigate this, HFD-fed POMC-Azgp1-OE or POMC-Cre mice were intraperitoneally injected with leptin (1 mg/kg) for 3 days. After leptin administration, BW and food intake decreased dramatically, especially in POMC-Azgp1-OE mice (Fig. 6a, b), suggesting that AZGP1 signaling in POMC neurons increased leptin sensitivity.

a, b Eight-week-old male POMC-Cre mice were given an injection of AAV9-DIO-Azgp1/GFP into the MBH and then fed a HFD for 4 weeks. Leptin was then administered subcutaneously. a Changes in daily food intake (n = 8 mice). b Changes in body weight (n = 8 mice). c Schematic diagram of the experimental procedure. d Western blot analysis of total and phosphorylated JAK2, STAT3, FOXO1, and mTOR expression in the hypothalamus. GAPDH served as the loading control (n = 4 mice). e IHC staining of STAT3 phosphorylation in the ARC (n = 4 mice; scale bars: 100 μm). f IF staining of POMC and c-Fos in the ARC (n = 3 mice; scale bars: 50 μm). MBH mediobasal hypothalamus, 3V third cerebral ventricle, ARC arcuate nucleus. The data are expressed as the mean ± SEM. Statistical significance was calculated using an unpaired two-tailed t-test (a, b) and two-way ANOVA followed by Bonferroni’s post hoc tests (d–f). Source data are provided as a Source Data file.
To further clarify the signaling pathway in which AZGP1 participates, leptin or artificial cerebrospinal fluid (aCSF) was infused into the MBH of HFD-fed POMC-Azgp1-OE or POMC-Cre mice (Fig. 6c). The effect of AZGP1 overexpression in the hypothalamus on the leptin signaling pathways was evaluated by western blotting (Fig. 6d). Consistent with the reductions in food intake and BW, the leptin-induced phosphorylation of JAK2 (pJAK2-Tyr1007/1008) and STAT3 (pSTAT3-Y705) was increased by AZGP1 overexpression in POMC neurons, while the phosphorylation levels of FoxO1 (Ser256) and mTOR (Ser2448) remained unchanged (Fig. 6d). Increased STAT3 phosphorylation was further confirmed by IHC staining (Fig. 6e). Similar results were observed in vitro. AZGP1 overexpression increased leptin-induced JAK2 and STAT3 phosphorylation in both the GT1-7 and Neuro2a (N2A) cell lines, whereas mTOR and FoxO1 phosphorylation levels remained unaffected (Supplementary Fig. 10a, b). Furthermore, leptin-induced POMC expression and the number of c-Fos-positive neurons were elevated by AZGP1 overexpression in HFD-fed mice, consistent with the increase in leptin sensitivity (Fig. 6f). In contrast, loss-of-function experiments revealed that ablation of Azgp1 in POMC neurons attenuated leptin-induced STAT3 phosphorylation and POMC expression (Fig. 7a, b). These data demonstrated that AZGP1 in POMC neurons protects against DIO by promoting leptin-mediated JAK2/STAT3 phosphorylation and pSTAT3- induced POMC expression, as well as increasing the excitability of POMC neurons.

a, b Eight-week-old male POMC-Azgp1 KO or Azgp1fl/fl mice were fed a HFD for 12 weeks and treated with or without leptin via MBH injection. IF staining of phosphorylated STAT3 (a) and POMC expression (b) in the ARC (n = 3 mice; scale bars: 200 μm). c–e POMC-Azgp1 KO and POMC-Cre:tdTomato (control) mice were fed a HFD for 4 weeks. Representative current-clamp traces (c), average firing rate (d) and resting membrane potential (e) of POMC neurons (n = 10 mice). 3V third cerebral ventricle, ARC arcuate nucleus. The data are expressed as the mean ± SEM, two-way ANOVA for (a–e). Source data are provided as a Source Data file. (n.s. not significant.).
The electrical activity and excitability of POMC neurons are altered by the hunger-satiety cycle and energy balance; and some hormones often affect the excitability and electrical activity of these neurons to regulate energy balance32. Therefore, whole-cell current clamp recording of POMC neurons was performed to investigate the effect of specific ablation of Azgp1 in POMC neurons on the electrophysiological properties of these neurons in HFD-fed mice. The baseline firing (spontaneous action potential, SAP) frequency of POMC neurons was significantly lower in POMC-Azgp1 KO mice than in Azgp1fl/fl mice (control), while the baseline resting membrane potential (RM) remained unchanged (Fig. 7c–e). Upon the administration of leptin to brain slices containing the MBH, an increase in the baseline firing frequency of POMC neurons was observed, and the deletion of Azgp1 in POMC neurons inhibited this leptin response (Fig. 7c, d). However, the RM was not obviously affected (Fig. 7e). Collectively, these results indicate that the regulation of metabolism by AZGP1 signaling may occur through a leptin-JAK2/STAT3-POMC-dependent mechanism in the hypothalamus.
Stat3 deletion in POMC neurons abolishes the effect of AZGP1 on metabolism
To obtain further insight into the role of STAT3 in the effects of AZGP1 on POMC neurons, Stat3fl/fl mice were crossed with POMC-CreER-tdTomato mice to generate tamoxifen-inducible POMC-Stat3 KO mice, in which Stat3 was deleted in POMC-expressing neurons after tamoxifen injection. Littermate POMC-CreER mice were employed as controls. The mice were intraperitoneally injected with tamoxifen at 6 weeks of age, then AAV9-DIO-Azgp1/GFP was injected into the MBH (Supplementary Fig. 11a). IF staining revealed that STAT3 (green) was localized in POMC neurons (tdTomato, red), whereas STAT3 localization in these neurons was significantly diminished in POMC-Stat3 KO mice (Supplementary Fig. 11b, c). Under HFD feeding, the effects of AZGP1 overexpression in POMC neurons on BW, energy intake, energy metabolism, and glucose/lipid metabolism were completely abolished by Stat3 deficiency (Supplementary Fig. 11d–u). These in vivo data further indicate that the protective effect of AZGP1 overexpression against DIO is mediated by the leptin-STAT3 signaling pathway in POMC neurons.
AZGP1 regulates leptin-JAK2-STAT3 signaling by interacting with AGK
A previous study using immunoprecipitation and mass spectrometry (IP-MS) analysis suggested that AZGP1 interacts with AGK33. To investigate the role of AGK in DIO, we examined AGK expression in the hypothalamus of WT mice. IHC staining showed that AGK expression was significantly lower in the hypothalamic ARC of mice fed a HFD than in those fed a NCD (Supplementary Fig. 12a). To elucidate the effect of AZGP1 overexpression on AGK in the hypothalamus, AAV9-Azgp1/GFP was injected into the MBH of 8-week-old male WT mice, which were then fed a HFD for 12 weeks. Western blotting and IF staining demonstrated that AZGP1 overexpression significantly increased AGK protein expression in the hypothalamus, especially in the MBH (Fig. 8a, b). In contrast, deletion of Azgp1 in POMC neurons significantly inhibited AGK expression in HFD-fed POMC-Azgp1 KO mice (Supplementary Fig. 12b). Based on these results, we hypothesize that AGK plays a key role in the influence of hypothalamic AZGP1 on metabolic phenotype. To test this hypothesis, WT mice were injected bilaterally with AAV-Azgp1/GFP or AAV-Azgp1 + AAV-shAgk into MBH and fed a HFD for 4 weeks. As shown in Supplementary Fig. 12c, d, Agk knockdown in the MBH under leptin stimulation completely eliminated the effects of central AZGP1 on food intake and BW. Furthermore, Agk knockdown also eliminated the effect of AZGP1 on JAK2 and STAT3 phosphorylation in the hypothalamus (Supplementary Fig. 12e). These effects were also observed in vitro (Fig. 8c). Interestingly, AZGP1 overexpression did not affect Agk mRNA expression in GT1-7 cells (Supplementary Fig. 12f), suggesting that AZGP1 is involved only in the post-transcriptional modification of AGK. To further characterize the relationship between AZGP1 and AGK, the subcellular localization of AZGP1 and AGK was analyzed by IF staining. The AZGP1 signaling overlapped with the AGK signal in GT1-7 (Fig. 8d), N2A cells (Supplementary Fig. 12g), and the MBH in WT mice (Supplementary Fig. 12h), indicating that the two proteins were colocalized in these cells. However, whether AZGP1 interacts directly with AGK remains unknown. Subsequent co-IP experiments were performed in N2A and GT1-7 cells and confirmed that AZGP1 and AGK exist within the same protein complex and interact with each other (Fig. 8e–g).

a, b Eight-week-old male WT mice were given an injection of AAV9-Azgp1/GFP into the MBH and fed a HFD for 12 weeks as described in the Methods. a AZGP1 and AGK protein expression in the hypothalamus (n = 4 mice). b IF staining of AGK in the hypothalamic ARC (n = 5 mice; scale bars: 50 μm). c GT1-7 cells were transfected with or without LV-Azgp1/GFP and/or LV-shAgk/vector as described in the Methods. Western blots showing AZGP1, AGK, t-JAK2/p-JAK2 (Tyr1007/1008), and t-STAT3/p-STAT3 (Y705) expression (n = 4 independent cell experiments). d IF staining showing the colocalization of AZGP1 and AGK in GT1-7 cells (n = 5 independent cell experiments; scale bars: 50 μm). e–g Cells were transfected with LV-Agk or LV-Azgp1. Cell extracts were subjected to immunoprecipitation (IP) with the specified antibodies. Co-IP analyses were performed in N2A (e) and GT1-7 (f, g) cells (n = 3 independent cell experiments). 3V third cerebral ventricle, ARC arcuate nucleus. The data are expressed as the mean ± SEM. Statistical significance was calculated using a two-tailed Student’s unpaired t-test for (a), and two-way ANOVA followed by Bonferroni’s post hoc tests for (c). Source data are provided as a Source Data file.
Ubiquitination serves as a critical mechanism in the modulation of protein levels34. Considering the positive regulation of AGK by AZGP1, it was postulated that AZGP1 might modulate the stability of the AGK protein. The effect of AZGP1 on AGK protein stability was assessed by treating LV-Azgp1/GFP–transfected GT-1-7 and N2A cells with cycloheximide (CHX), a protein synthesis inhibitor. The results showed that the degradation speed of the AGK protein was reduced by Azgp1 overexpression (Fig. 9a, b), while it was accelerated by Azgp1 knockdown (Fig. 9c), indicating that AZGP1 affected the stability of the AGK protein.

a, b GT1-7 or N2A cells were transfected with LV-Azgp1/GFP and subsequently treated with or without cycloheximide (CHX, 20 μg/ml). The stability of the AGK protein was measured by western blotting in GT1-7 (a) and N2A (b) cells (n = 3 independent cell experiments). c GT1-7 cells were transfected with LV-shAzgp1/shGFP and treated with CHX (20 μg/ml) for the indicated times. The stability of the AGK protein was examined by Western blotting (n = 3 independent cell experiments). d, e GT1-7 or N2A cells were transfected with LV-Azgp1/GFP and treated with or without MG132 (40 μM). AGK protein expression was measured by Western blotting in GT1-7 (d) and N2A (e) cells (n = 5 independent cell experiments). f, g N2A cells were transfected with LV-Azgp1/GFP and treated with or without MG132 or 3-MA. AGK protein expression was measured by western blotting in MG132-treated (f) and 3MA-treated cells (g) (n = 5 independent cell experiments). h, i GT1-7 and N2A cells were transfected with or without LV-Azgp1. Co-IP analyses were performed to evaluate the endogenous ubiquitination of AGK in GT1-7 (h) and N2A (i) cells (n = 3 independent cell experiments). j HEK293T cells were transfected with plasmids expressing Myc-Azgp1 and/or HA-Ub and Flag-Agk as described in the Methods. Co-IP analyses were performed to assess the proteasome-dependent ubiquitination of AGK (n = 3 independent cell experiments). k Schematic illustration of cellular and molecular events underlying central AZGP1-mediated regulation of energy metabolism. P Phosphorylation, ARC arcuate nucleus, BAT brown adipose tissue, WAT white adipose tissue. The data are expressed as the mean ± SEM, two-tailed Student’s unpaired t-test was used for (a–c). Source data are provided as a Source Data file.
Next, LV-Azgp1-transfected GT1-7 or N2A cells were treated with the proteasome inhibitor MG132 or the lysosome inhibitor 3-methyladenine A (3MA). The results showed that MG132 treatment significantly increased the expression of the AGK protein, while only a slight increase in AGK protein expression was observed in Azgp1-overexpressing cells (Fig. 9d, e). In contrast, Azgp1 knockdown decreased the expression of AGK protein in N2A cells, while MG132 treatment blocked this effect (Fig. 9f). However, 3-MA treatment did not result in changes in AGK expression in N2A cells (Fig. 9g). Therefore, the data presented here reveal that AZGP1 modulates AGK stability in a proteasome-dependent manner.
To further determine the effect of AZGP1 on the ubiquitination of AGK, GT1-7, and N2A cells were transfected with LV-Azgp1/GFP. The endogenous ubiquitination of AGK was evaluated by co-IP analysis. In Azgp1-overexpressing GT1-7 and N2A cells, the ubiquitination of AGK was strongly suppressed (Fig. 9h, i). Similarly, exogenous ubiquitination analysis showed that AZGP1 inhibited the ubiquitination of AGK (Fig. 9j). Collectively, these findings demonstrate that during HFD feeding, AZGP1, which is downregulated, interacts with AGK to promote its proteasome-dependent ubiquitination and degradation, hence inactivating the downstream leptin-JAK2/STAT3-POMC pathway.
Source link