Phenotypic observation of fruits and leaves of three Rosaceae plants
By examining mature fruits and complete leaves of red flesh apple, purple leaf plum, and purple leaf peach, it was observed that the fruit of red flesh apple and purple leaf plum had a purplish-red color, while the fruit of purple leaf peach was green. Interestingly, the leaves displayed different colors compared to the fruit. Specifically, the leaves of red flesh apple, purple leaf plum, and purple leaf peach were green, purple, and purple, respectively (Fig. 1).

Content of flavonoids and anthocyanins and Phenotype in three Rosaceae plant materials. (A) Phenotype of AF, PEF, PLF in fruits and AL, PEL, PLL in leaves of three Rosaceae plants; (B) flavonoid contents; (C) anthocyanin contents; (D) tissue extract.
To further investigate this phenomenon, we determined the flavonoid and anthocyanin contents in six groups of plant materials. The results revealed that the flavonoid content in the fruit of purple leaf plum was significantly lower than those of the other five materials, whereas the fruit of purple leaf peach exhibited the highest flavonoid content. The flavonoid contents in the remaining four groups showed no significant differences (Fig. 1B).
Regarding anthocyanin content, red flesh apple fruit demonstrated significantly higher levels than the other groups. Following this, purple leaf plum leaf and purple leaf peach leaf displayed relatively high anthocyanin content, while the anthocyanin content in purple leaf peach fruit was the lowest (Fig. 1C).
Considering the phenotypic observations, a clear correlation emerged: the darker the plant material, the higher the anthocyanin content. Additionally, the light-colored fruits and leaves exhibited remarkably high flavonoid content, suggesting the possibility of metabolic differences between them (Fig. 1D).
Metabolic analysis of fruits and leaves of three Rosaceae species
The qualitative and quantitative analysis of metabolites and differential abundance metabolites (DAMs) components in six sample groups was performed using the widely targeted metabolic group of UPLC-MS/MS-based mass spectrometry. After quality evaluation, a total of 311 metabolites were detected, including 47 flavonoids, 105 flavonols, 16 chalcones, 37 dihydroflavonols, 8 dihydroflavonols, 30 anthocyanins, 14 flavonoid carbon glycosides, 23 flavanols, 8 isoflavones, 11 tannins, and 12 proanthocyanidins (Fig. 2A). HCA evaluation revealed differences in flavonoid metabolism among the six sample groups (Fig. 2B). Leaves exhibited higher enrichment levels (Species and relative content) of flavonoids than fruits, and the samples could be classified into six clusters based on the varying isoflavone enrichment levels. Cluster 1 showed the highest level of purple PEL, while cluster 2 had higher purple PLL accumulation. Cluster 3 showed the highest expression in purple PLF, followed by cluster 2. Cluster 4 had a significant accumulation of red AF, followed by cluster 6. Cluster 5 exhibited a notable accumulation of green PEF. Cluster 6 showed evident enrichment of green AL. This indicates different flavonoid accumulation patterns between the fruits and leaves of the three Rosaceae plants, with partial overlap of flavonoid metabolites within the same variety of plants.

Metabolites analysis of fruits and leaves of three species of Rosaceae. (A) Classification pie chart of flavonoids; (B) differential metabolites clustering heat map. Horizontal for the sample name, vertical for the metabolite information, Group for the grouping, Class for the substance classification, different colors for the relative content standardized values (red for high content, green for low content), the clustering line on the left side of the figure is the metabolite clustering line, and the clustering line at the top of the figure is the sample clustering line; (C) principal component analysis (PCA); (D) correlation analysis diagram of differential metabolites. longitudinally and diagonally represent the sample names of different samples, different colors represent different Pearson correlation coefficients, the redder the color is, the stronger the positive correlation is, the whiter the color is, the worse the correlation is. The bluer the color is, the stronger the negative correlation is, and the size of the circle is proportional to the degree of correlation. At the same time, the correlation coefficient between the two samples is marked in the box.
PCA analysis (Fig. 2C) revealed distinct separation among the six sample groups, with closely gathered repeated samples. Three different regions could be distinguished, indicating variations in flavonoid metabolites in each region. The first group comprised purple PEL, green PEF, red PLF, and red AF, indicating similar flavonoid characteristics. The second group included purple PLL, and the third group included green AL. Therefore, although the results showed that the flavonoids in the fruits of the three Rosaceae plants were similar, they greatly differed in the leaves. The correlation heat map (Fig. 2D) also demonstrated good biological repetition among the six sample groups.
To further explore these differences, a preliminary analysis of the metabolites was conducted. The results showed modifications of quercetin, cypermethrin, kaempferol, luteolin, taraxanthin, hesperidin, apigenin, Tamariaxanthin, hesperidin, halcyrhamneol, and isorhamnetin through various glycosidic bonds in fruits and leaves of different colors. Glycosylation occurred at positions 8, 6, 3, 5, and 7, including neo-hesperidin, glucoside, isorhamnose, galactose, rutin, and glucuronide glycosylation. Eight flavonoids, namely Delphinidin-3-O-(6″-O-p-coumaroyl) glucoside, Peonidin-3-O-glucoside, Catechin, Naringenin-7-O-glucoside (prunin), Epicatechin, Quercetin-3-O-galactoside (Hyperin), Quercetin-3-O-rutinoside (Rutin) and Quercetin-7-O-Rutinoside, were co-enriched and exhibited high relative abundance in the six sample groups (Fig. 3A–H).
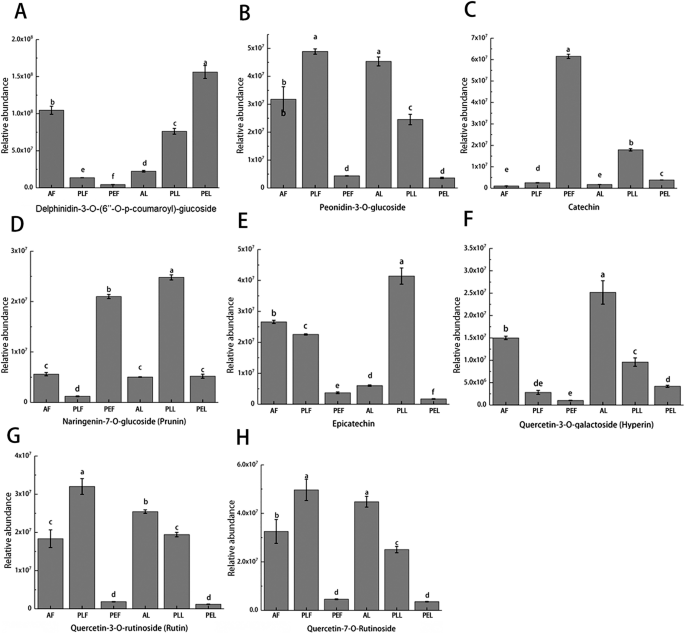
Relative abundance of anthocyanins and other flavonoids in the six groups of samples (A–H).
Screening of DAMs in the fruits and leaves of three Rosaceae species
DAMs were screened using the criteria of VIP ≥ 1 and log2FC (folding change) ≥ 1. A total of 183 DAMs (71 accumulated and 112 reduced) were identified between red AF and green PEF (Fig. 4A). Among them, 15 flavonoids and 15 dihydroflavonoids were accumulated, while 51 flavonols showed significant down-regulation. Between red AF and red PLF (Fig. 4B), there were 197 DAMs (91 accumulated and 106 reduced), with 29 flavonols accumulated and 38 reduced. To compare green PEF and red PLF, 189 DAMs (107 accumulated and 82 reduced) were found (Fig. 4C). Among them, 43 flavonols were significantly accumulated, while 21 dihydroflavonols and 18 flavonols were significantly reduced. Additionally, between green AL and purple PEL (Fig. 4D), 227 DAMs (77 accumulated and 150 reduced) were identified. Among them, 20 dihydroflavonoids and 16 flavonols were significantly accumulated, while 67 flavonols showed significant down-regulation. Between green AL and purple PLL, there were 255 significantly accumulated and reduced DAMs (Fig. 4E). Specifically, 41 flavonols, 23 flavonoids, and 19 anthocyanins were significantly accumulated, while 45 flavonols were significantly reduced. To compare purple PEL and purple PLL (Fig. 4F), 236 DAMs (182 accumulated and 54 reduced) were observed. Among them, 75 flavonols and 19 anthocyanins were significantly accumulated, while 19 dihydroflavonoids showed significant down-regulation. In general, most differential metabolites in the six sample groups were flavonols, flavonoids, dihydroflavonoids, and anthocyanins. These compounds displayed a certain complementary trend within each sample. Compared to green PEF and AL, dark fruits and leaves exhibited lower levels of most flavonoids (flavonols, flavonoids, and dihydroflavonoids), while the contents of certain anthocyanins were higher.